Unlocking learner engagement and performance - A multidimensional approach to mapping learners to learning cohorts
Abstract
Learning analytics, located at the intersection of learning science, data science, and computer science, aims to leverage educational data to enhance teaching and learning. However, as educational data increases, distilling meaningful insights presents challenges, particularly concerning individual learner differences. This work introduces a comprehensive approach for designing and automatically mapping learners into meaningful cohorts based on diverse learning behaviors. It defines four critical contexts, including engagement, direction, repetitiveness, and orderliness, and generates practical learning cohorts from their combinations. The approach employs a time-series-based clustering method with K-means clustering using dynamic time warping to identify similar learning patterns. Statistical techniques like the Mann-Kendall test and Theil-Sen estimator further refine the process. A case study on data science courses validates the approach, offering novel insights into learner behavior. The contributions include a novel time series approach to characterizing learning behavior, new learning cohorts based on critical contexts, and a systematic method for automated cohort identification.
Practical problem
Instructors and online-education platforms collect huge volumes of clickstream and video-watching data, but turning it into something actionable means dealing with the fact that learners behave very differently from one another. The usual answer is cohort analysis: grouping learners with similar behaviour so that interventions, course design, and support can be targeted. In practice, however, cohorts are defined almost entirely by how much a learner engaged (samplers, completers, dropouts) and are often identified by hand. Other aspects of behaviour that teachers care about, such as whether learners follow the intended lecture order, revisit material, or jump around erratically, are left out, and the resulting groups are too coarse to explain why some learners succeed and others leave.
Research questions
- How effectively does a time-series clustering method categorize students into pre-defined, multidimensional learning cohorts in a real-world online course setting?
- What insights into learner behaviour, achievement, and interaction can be derived from analyzing the identified learning cohorts?
Contributions
- A taxonomy of nine learning cohorts (for example Orderly Engagers, Recurrent Disorderly Observers, Contrary Learners) derived from four behavioural dimensions: engagement, direction, repetitiveness, and orderliness.
- A representation of learning behaviour as a time series over logical time, mapping the sequence of lectures a learner watched against the course’s prescribed order.
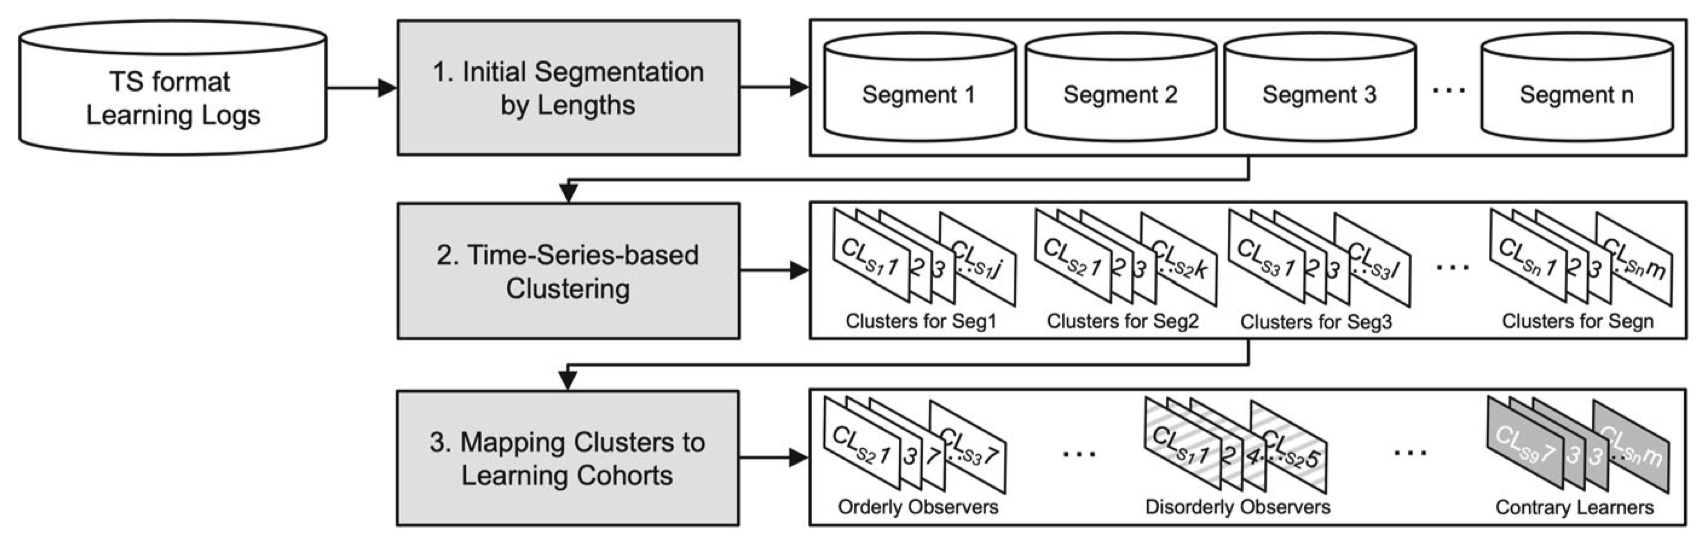
- A method that segments learners by record length, clusters them with K-means under dynamic time warping, and computes DTW barycenters per cluster.
- A rule-based mapping of barycenters to cohorts using the Mann-Kendall trend test, the Theil-Sen slope estimator, and a log-difference fluctuation measure.
- A case study on three data-science courses (18,405 learners, 171,440 video-watching events) from a real online education platform, including process models discovered with Fluxicon
Disco.
Key findings
- The method assigns learners of all three courses to the nine cohorts; Recurrent Orderly Observers are the largest cohort everywhere (16.6%, 17.1%, and 14.8% of learners in courses A, B, and C).
- Over half of the learners in every course (51.6%, 62.9%, 58.5%) watch under 10% of the material and cannot be cohorted, highlighting early attrition on the platform.
- Of 670 learners enrolled in two or more courses, only 162 (26%) keep the same cohort; a chi-squared test (178.68 vs. critical 6.63, p < 0.01) shows cohorts depend more on the course than on the learner.
- Recurrent Orderly Engagers obtain the highest quiz scores and pass ratios in courses A and C and the highest interaction scores in all three courses; in project-based course B, Recurrent Disorderly Engagers score highest.
- Cluster counts and thresholds (for example the 0.6 log-difference cut-off) still need expert judgement, dynamic time warping is costly at scale, no ground-truth cohorts exist for validation, and cohorts are static over a course.